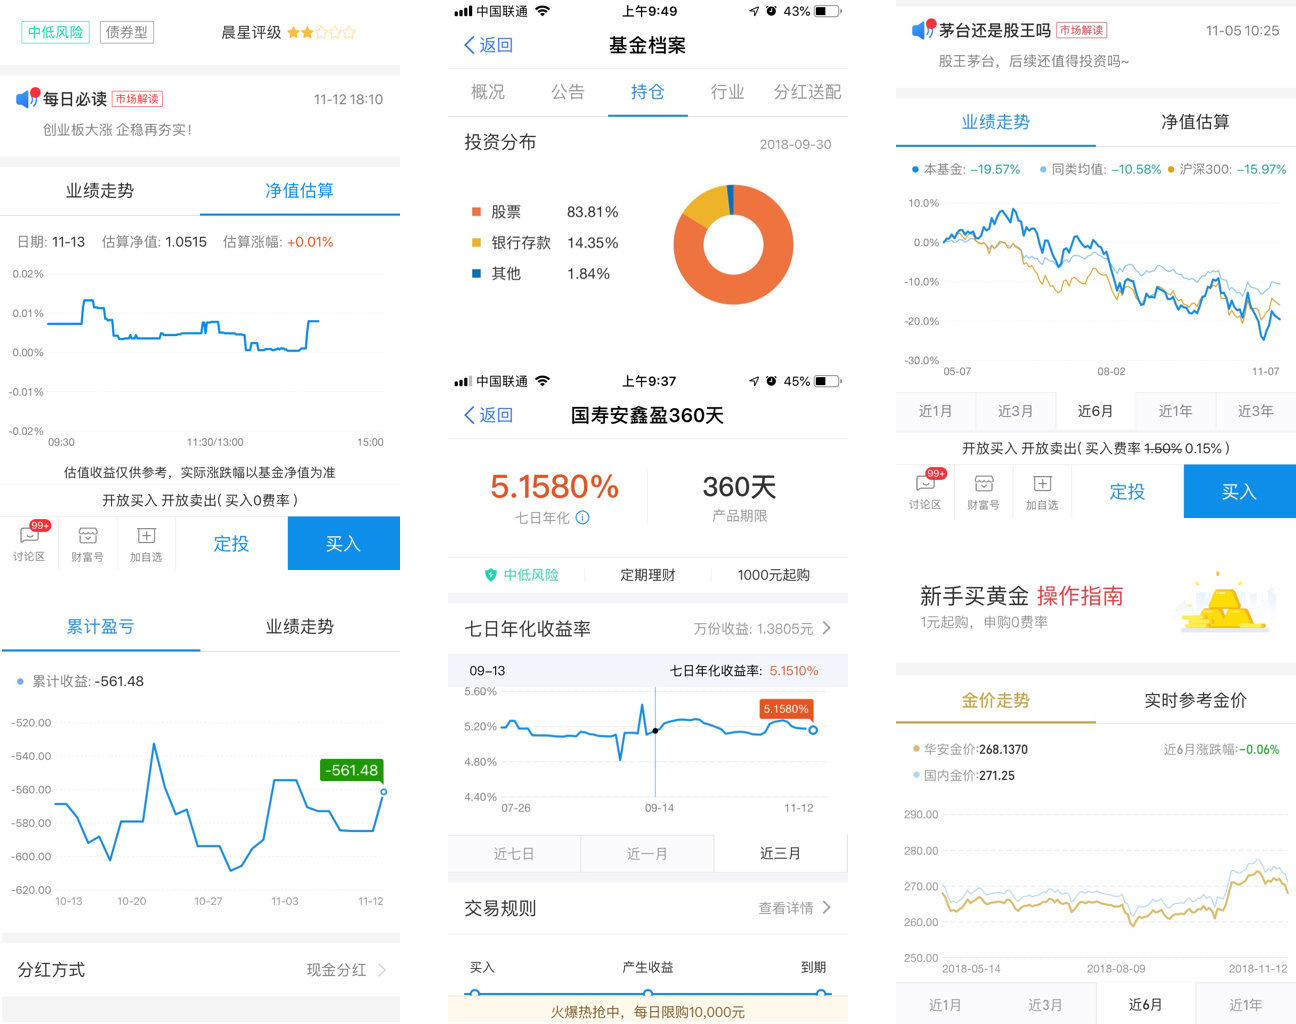
<WEcharts>
<WEcharts>是一个基于echarts (opens new window)封装的图表组件,若您下载的模板中没有自带,请手动拷贝国际化模板中components/WEcharts文件夹到自己的项目中。组件详情 (opens new window)
子组件
无
配置参数
| 属性名 | 类型 | 描述 | 默认值 |
|---|---|---|---|
| options | Object | echarts配置数据,详情请看配置项 (opens new window) | - |
| baidukey[可选] | String | 百度地图key,使用echarts中的地图功能时需要,百度开放平台申请 (opens new window) | - |
事件回调 callback
无
示例代码
<template>
    <div class="app">
        <navbar class="navbar">
            <navbar-item type="back"></navbar-item>
            <navbar-item type="title">
                <text class="title">{{title}}</text>
            </navbar-item>
        </navbar>
        <div class="main">
            <WEcharts class="echarts" :options="options"></WEcharts>
        </div>
    </div>
</template>

<style scoped>
    .app {
        width: 750px;
        flex: 1;
        background-color: #ffffff;
    }

    .navbar {
        width: 750px;
        height: 100px;
    }

    .title {
        font-size: 28px;
        color: #ffffff
    }

    .main {
        flex: 1;
        justify-content: center;
    }

    .echarts {
        width: 750px;
        height: 750px;
    }
</style>

<script>
    import WEcharts from "../components/WEcharts/index";
    const eeui = app.requireModule('eeui');

    export default {
        components: {WEcharts},
        data() {
            return {
                title: '折线图 Basic Line Chart',
                options: {
                    xAxis: {
                        type: 'category',
                        data: ['Mon', 'Tue', 'Wed', 'Thu', 'Fri', 'Sat', 'Sun']
                    },
                    yAxis: {
                        type: 'value'
                    },
                    series: [{
                        data: [820, 932, 901, 934, 1290, 1330, 1320],
                        type: 'line'
                    }]
                }
            }
        },
        methods: {

        }
    };
</script>
自定义图表
理论上所有基于web【JavaScript】的图表都可以使用
可以参考,模板中的echarts图表组件封装示例,详情请看 (opens new window)
移动端推荐使用F2图表 (opens new window) F2 移动端可视化方案 F2 是一个专注于移动,开箱即用的可视化解决方案,完美支持 H5 环境同时兼容多种环境(Node, 小程序,Weex),完备的图形语法理论,满足你的各种可视化需求,专业的移动设计指引为你带来最佳的移动端图表体验。 F2 Github地址:https://github.com/antvis/f2 (opens new window)

← <web-view> <div> →
